Divorce Statistics 2025: Key Facts at a Glance
The infographic and the figures below are drawn from the ONS Divorces in England and Wales publication, released in July 2025, which covers divorces granted during the 2023 calendar year. Journalists and researchers are welcome to cite them with attribution to Stowe Family Law and the ONS.
- The divorce rate per 1,000 married population was 8.6 (men) and 8.5 (women).
- The median marriage duration at divorce was 12.7 years for opposite-sex couples.
- Female same-sex couples dissolved marriages at a rate of 11.2 per 1,000, compared to 7.4 per 1,000 for male same-sex couples.
- Family breakdown costs the UK economy approximately £47.31 billion per year (Relationships Foundation).
How Many Marriages End in Divorce in the UK?
According to the Office for National Statistics (ONS), approximately 42% of marriages in England and Wales are projected to end in divorce – significantly lower than the widely circulated “50% myth” that continues to appear in media coverage and everyday conversation. So, do half of all marriages end in divorce? Not according to the data.
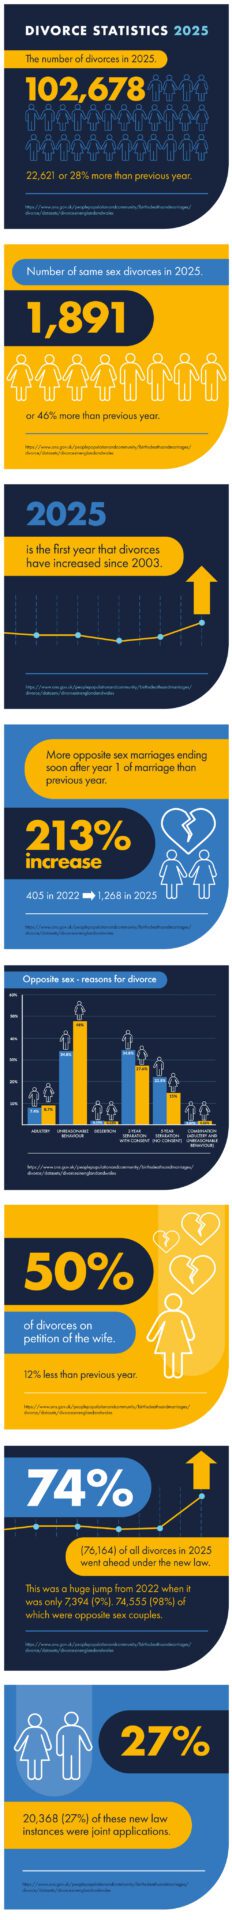
The 2025 data shows that 102,678 divorces were granted in England and Wales. When civil partnership dissolutions are included, the total reaches 103,816. This represents a 28% rise on the previous year’s figure of 80,057, and the first year-on-year increase in divorce numbers since 2003.
That context is essential: the figure from the data released in 2024 was historically low, artificially suppressed by the administrative disruption caused by the transition to the new no-fault divorce system introduced in April 2022. The 2025 numbers represent a return to pre-pandemic norms, not evidence of a sudden surge in marital breakdown.
The divorce rate per 1,000 married population stood at 8.6 for men and 8.5 for women. Based on the annual figure, that equates to approximately 281 divorces granted every day in England and Wales.
UK Divorce Rate Over Time: Key Trends
Divorce rates in England and Wales have followed a long and complex trajectory. After rising steeply through the 1970s and 1980s following the liberalisation of divorce law, rates peaked in the early-to-mid 1990s, reaching 12.4 per 1,000 married population in 1994.
Since then, the overall direction of travel has been one of gradual decline, interrupted by short-term fluctuations. So, are divorce rates in the UK increasing? The short answer is no, though the picture requires some explanation.
The most striking recent data point was in 2022, which recorded the lowest divorce rate since 1971. Rather than reflecting improved marital stability, this was a direct consequence of the courts adjusting to the new no-fault divorce system, which created a temporary backlog and processing delay.
ONS cohort analysis provides the most reliable long-term picture for how marriages are actually playing out over time, drawn from the ONS Divorces in England and Wales: 2025 bulletin:
- The 1963 marriage cohort: 27.1% had divorced by their 60th wedding anniversary.
- The 1998 marriage cohort: 40.7% had divorced by their 25th anniversary.
- The 2013 marriage cohort: 16.8% had divorced by their 10th anniversary, continuing a clear downward trend across successive cohorts.
The 28% rise in divorces from last year’s data should not be read as evidence that divorce rates are increasing in any meaningful sense. It reflects the clearing of a backlog created during the legislative transition, and sits within a broader long-term decline driven by later marriage ages, changing social attitudes, and evolving relationship patterns.
Who Files for Divorce?
Historically, wives have initiated the majority of divorce petitions in England and Wales. According to the ONS, women have been the primary instigators of divorce in opposite-sex relationships since 1949, and in recent years, around 62–63% of petitions have been filed by wives.
The introduction of no-fault divorce in April 2022 has significantly changed how divorces are filed. The 2025 dataset shows that 73.1% of divorces under the new legislation were sole applications, with 26.7% being joint applications – a category that simply did not exist under the previous system.
Meanwhile, 50% of divorces processed under the old law were on the petition of the wife, representing a 12% decrease on the previous year, reflecting the rapid uptake of joint applications under the new regime.
Under the previous fault-based system, the petition data revealed clear patterns:
- Unreasonable behaviour was the most common ground: cited in 63.7% of wife petitions and 45.2% of husband petitions. Wives were almost three times more likely than husbands to cite it, often alongside adultery.
- Two-year separation with consent was more commonly used by husbands (27.5%) than wives (16.5%).
- Five-year separation without consent featured in 20.9% of husband petitions and 11.1% of wife petitions.
- Desertion was the least cited ground, appearing in under 0.4% of cases.

Divorce by Duration of Marriage
When do most divorces actually happen? The data challenges some popular assumptions.
According to the ONS, the median duration of marriage at the point of divorce was 12.7 years for opposite-sex couples in 2023 – so how long do marriages last in the UK before divorce? On average, just under 13 years. The so-called “2–5 year itch” is not well supported by the statistics.
Key findings from ONS cohort data on divorce by duration:
- Fewer than 1 in 5 marriages from the 2011 cohort ended in divorce within 10 years. What percentage of marriages end in divorce in the first 5 years? Considerably fewer than popular perception suggests.
- 32% of marriages are expected to end in divorce by the 20th anniversary.
- There was a 68% decrease in divorces occurring just 1–2 years after marriage under the new legislation, compared to the old system.
- 1,268 divorces involved couples married for 1–2 years – up 213% from 405 the previous year, largely reflecting the post-transition backlog clear-up rather than a genuine trend.
The highest concentrations of divorce occur in the 10–20 year range, consistent with couples who married in their late twenties or early thirties reaching their forties before separating. The most common time to get divorced, based on the ONS data, falls within this window.
Same-Sex Divorce Statistics
Same-sex divorce data has been collected since same-sex marriage became legal in England and Wales in March 2014. The 2025 dataset shows there were 1,891 same-sex divorces, the highest number on record, and a 46% increase compared to the previous year. Same-sex divorce statistics in the UK continue to evolve as the first cohorts of same-sex married couples reach longer marriage durations.
Dissolution rates and median marriage durations differ notably between male and female same-sex couples:
| Metric | Male same-sex couples | Female same-sex couples |
| Dissolution rate per 1,000 civil partnerships | 7.4 | 11.2 |
| Median marriage duration at divorce | 7.2 years | 6.3 years |
Female same-sex couples consistently show higher dissolution rates than male same-sex couples, a pattern mirrored in comparable data from other countries where same-sex marriage records have been maintained for longer.
Age and Demographics
The average age at divorce has risen over time, broadly reflecting increasing ages at marriage. The most recent ONS figures for average age at divorce relate to 2019, after which the ONS stopped publishing this specific measure in its statistical bulletins. The last available data showed men divorcing at around 45 and women at around 42.
What the ONS Divorces in England and Wales: 2025 bulletin does confirm is the significant rise in marriage ages driving this trend: the median age at marriage for opposite-sex couples rose from 29.6 years (men) and 27.6 years (women) in 1994, to 34.8 years (men) and 32.9 years (women) by 2022.
The 40–44 age group has consistently recorded the highest divorce rates of any age band, making it the most common age to get divorced in the UK. Couples who marry in their teens or early twenties face substantially higher lifetime divorce risk than those who marry in their late twenties or thirties.
The average age at first marriage has risen significantly over the past three decades, and this structural shift is one of the key factors behind the long-term decline in the average UK divorce rate. As couples marry later, they tend to be more financially stable, better established in their careers, and clearer about their long-term compatibility.
Common Reasons for Divorce
Under the fault-based system in place prior to April 2022, petitioners were required to cite one of five legal grounds.
The data on reasons for divorce in the UK from that period showed unreasonable behaviour as the dominant ground, used in 63.7% of wife petitions and 45.2% of husband petitions, followed by two-year separation with consent, five-year separation without consent, adultery, and desertion.
The ONS 2025 divorce dataset, which looks at the 2023 data, reflects the introduction of no-fault divorce in April 2022 under the Divorce, Dissolution and Separation Act 2020. Couples no longer need to cite a specific reason and instead state that the marriage has “irretrievably broken down.”
As a result, 74.2% of divorces in 2023 (76,164 cases) were granted under the no-fault system, meaning most divorces no longer record a behavioural reason.
Information on grounds in 2023 applies only to cases filed under the previous legislation, which made up 25.5% of final divorce orders and 32.1% of final dissolution orders granted that year.
For these legacy cases filed before April 2022, the most commonly cited reasons were:
| OPPOSITE SEX | SAME SEX | |||
| Party to whom granted ➡️
Reason for Divorce ⬇️ |
Husband
(Total 8,607) |
Wife
(Total 17,272) |
Male
(Total 135) |
Female
(Total 144) |
| Adultery | 515 (6%) | 1,404 (8.1%) | 8 (5.9%) | 4 (2.78%) |
| Unreasonable behaviour | 3,888 (45.2%) | 10,993 (63.7%) | 87 (64.4%) | 86 (59.7%) |
| Desertion | 29 (0.34%) | 66 (0.38%) | 0 (0%) | 3 (2.08%) |
| 2 year separation with consent | 2,369 (27.5%) | 2,856 (16.5%) | 31 (22.96%) | 42 (29.17%) |
| 5 year separation (no consent) | 1,800 (20.9%) | 1,924 (11.1%) | 9 (6.67%) | 9 (6.25%) |
| Combination (adultery an unreasonable behaviour) | 6 (0.07%) | 29 (0.17%) | 0 | 0 |
The wider economic cost of relationship breakdown is substantial. The Relationships Foundation’s Cost of Family Failure Index estimates that family breakdown costs the UK taxpayer £47.31 billion per year, encompassing financial support for lone parent families, healthcare, social care, civil and criminal justice, and education costs.
No-Fault Divorce and Its Impact on Statistics
The Divorce, Dissolution and Separation Act 2020 came into force on 6 April 2022, representing the most significant reform to divorce law in England and Wales in over 50 years. The key changes were the removal of the requirement to prove fault or wait out separation periods, the introduction of joint applications for the first time, a mandatory 20-week reflection period before the final order, and the elimination of the ability for one spouse to contest the divorce.
The no-fault divorce statistics speak for themselves. In 2023, 74.2% of all divorces – 76,164 in total – were granted under the new legislation, up from just 9.2% in 2022 when the law had only been in force from April. Of those new-law divorces: 73.3% were sole applications; 26.7% (20,368) were joint applications; and 98% involved opposite-sex couples.
The transition created a statistical anomaly that explains the apparent spike in the divorce rate between 2022 and 2023, it reflects backlog clearance, not a genuine rise in marital breakdown.
How Much Does Divorce Cost?
The court application fee currently stands at £593, rising shortly to £612. Beyond this fixed cost, total divorce costs vary considerably depending on the complexity of the case.
The main cost drivers are whether you instruct a divorce solicitor or proceed without legal representation, whether a financial settlement needs to be negotiated, whether child arrangements are contested, and whether the divorce itself is uncontested or disputed.
Contact our expert divorce solicitors at Stowe Family Law
If you need support with divorce matters, please get in touch with our expert divorce solicitors at Stowe Family Law.
You can call us on 0330 159 9949 or complete our contact form, and a member of our team will be in touch.
Sources: